Contents
- 1) Business Problem
- 2) Objectives & KPIs
- 3) Data Sources
- 4) Architecture
- 5) Data Model
- 6) Transform Logic (Gold)
- 7) Orchestration & Quality
- 8) Security & Cost
- 9) Results
- 10) How to Run
- 11) Dashboard (Screens)
- 12) Credits & Contact
1) Business Problem
Decision makers need a transparent view of how price leaks from List to Pocket and which levers (discounts, rebates, freight, fees, cost) most affect profitability. They also need elasticity signals to guide price actions without sacrificing volume.
2) Objectives & KPIs
Objectives
- Production-style margin waterfall and leakage analytics.
- Elasticity by product/category; baseline for what-if pricing.
- Reproducible pipeline with orchestration, tests, and BI.
Core KPIs
- Revenue, Net Revenue, Pocket Margin (Amt & %)
- Leakage % (Std Discount, Promo, Rebate, Freight/Fees)
- Contribution per unit, Elasticity (β_price), Customer profitability
3) Data Sources
- Sales/Invoices: product, customer, region, qty, price & discount components
- Costs: monthly COGS, freight-in, duty (landed cost per unit)
- Price Lists: validity windows by region/channel
- Dimensions: product, customer, region
Demo uses synthetic CSVs (generated via Python) → Snowflake.
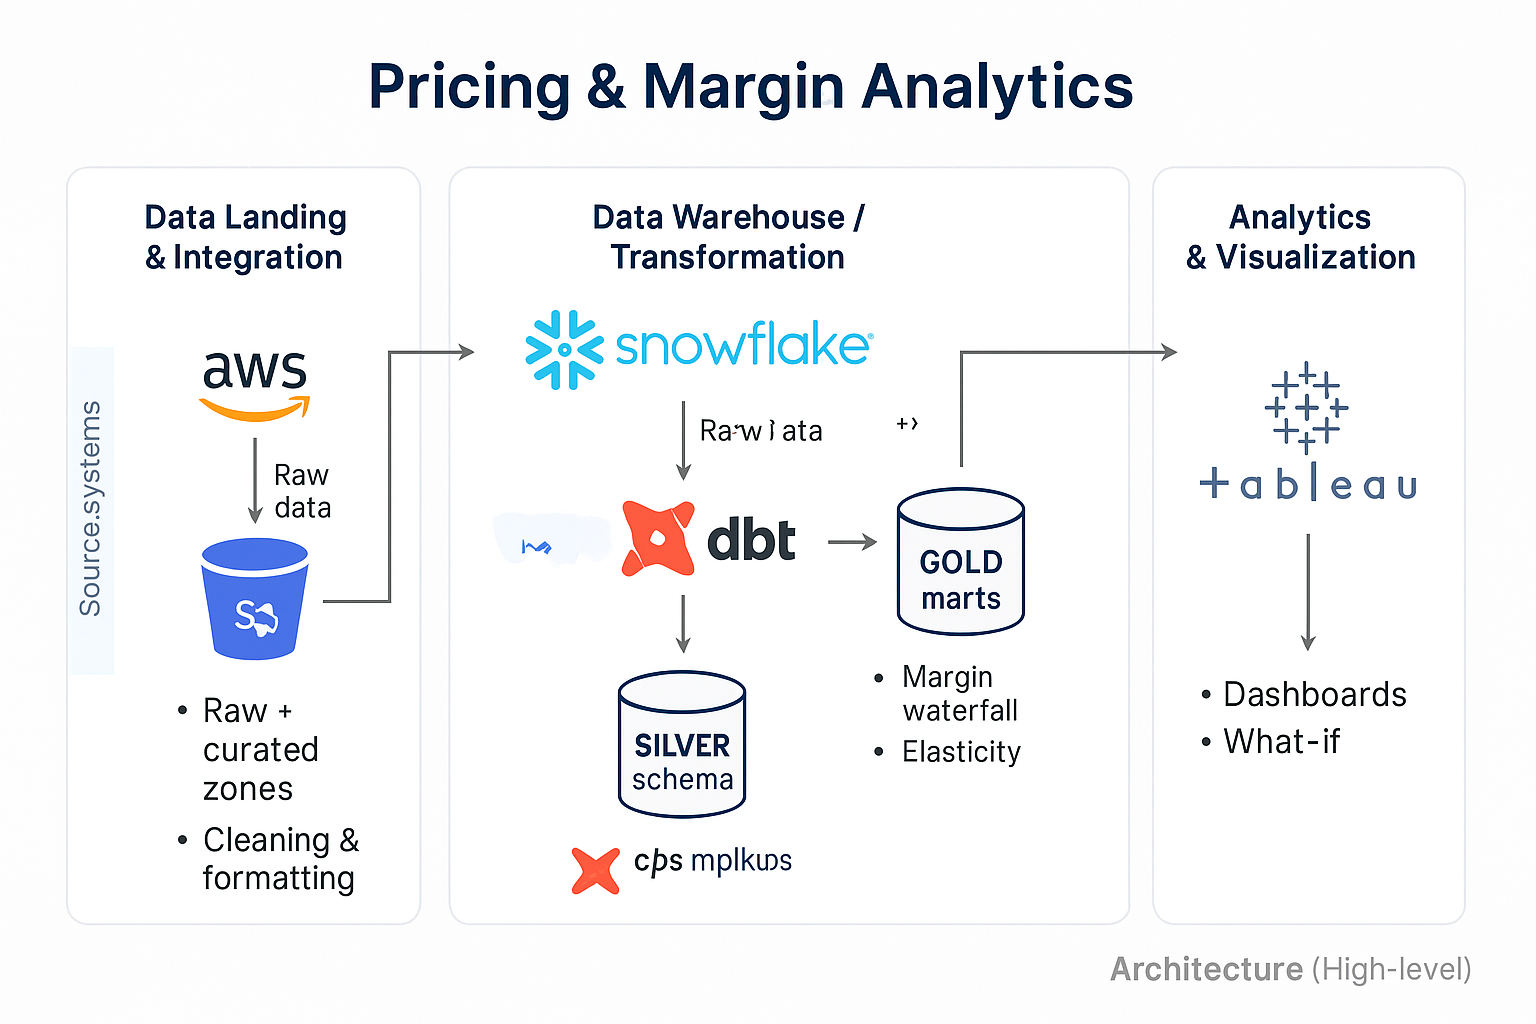
4) Architecture
- Ingestion & Storage: AWS S3 (raw/curated), optional Glue for schema
- Warehouse/ELT: Snowflake (Bronze → Silver → Gold) with dbt models/tests
- Orchestration: Airflow (MWAA) + EventBridge triggers
- Quality/Lineage: Great Expectations, OpenLineage (optional)
- Analytics: Python (elasticity, what-if)
- BI: Tableau / Power BI
5) Data Model
Silver layer
FACT_SALES_CLEAN— invoice lines with qty, list_price, discounts, promo, rebate, freight_out, feesFACT_COST— monthly landed cost per productFACT_PRICE_LIST— pricing validity windowsDIM_PRODUCT,DIM_CUSTOMER,DIM_REGION
Gold marts
GOLD.MART_MARGIN_WATERFALLGOLD.MART_ELASTICITY
6) Transform Logic (Gold)
Waterfall (List → Invoice → Net → Pocket)
invoice_price_unit = list_price − (std_discount_amt / qty)net_price_unit = list_price − ((std_discount_amt + promo_amt + rebate_accrual_amt) / qty)landed_cost_unit = cogs + freight_in + dutyvar_selling_cost_unit = (freight_out_amt + payment_fees_amt) / qty- Pocket Margin / unit =
net_price_unit − landed_cost_unit − var_selling_cost_unit
Elasticity (sketch)
- Weekly log-log regression per product/category:
ln(Q) ~ ln(Price) + seasonality + promo_flags - Output to
GOLD.MART_ELASTICITYwith β_price, R², significance.
7) Orchestration & Quality
Airflow DAG (nightly)
- Generate/load data to S3
- Bronze → Silver standardization
- dbt Silver conformance
- dbt Gold waterfall
- Python elasticity job →
GOLD.MART_ELASTICITY - Publish BI / refresh extracts
Data Quality (Great Expectations)
- Non-null keys (invoice_id, product_id, customer_id)
- Non-negative qty & price
- Pricing windows valid (from ≤ to)
- Cost sanity: landed_cost_unit within expected band
8) Security & Cost
- RBAC: INGEST / TRANSFORM / ANALYST roles, least privilege
- Warehouses: XSMALL auto-suspend (60s) per tier
- S3: private buckets, lifecycle for cold storage
- KMS & Secrets: keys/creds outside code; parameterized connections
- Cost levers: partition pruning, small WH for transforms, BI extracts off-peak
9) Results
- Runtime: p95 report time ↓ 11m → ~90s (XS Snowflake WH)
- Visibility: Top leakage drivers by customer × category
- Actionability: Elasticity flags SKUs with headroom for price increases
10) How to Run
1) Generate sample data python src/generator/make_dataset.py
2) Load CSVs to Snowflake (via COPY INTO or DataGrip)
3) Build marts dbt run –select gold.mart_margin_waterfall
4) (Optional) Run elasticity job python src/elasticity/fit_elasticity.py
5) Point Tableau/Power BI to PRICING_DB.GOLD
11) Dashboard (Screens)
Executive Overview

Leakage Explorer

Elasticity & What-if

Customer Profitability

If you enjoyed this, explore my projects and visuals on 👉 pawanjadhav.cloud or GitHub PawanJadhav7